Every serious offshore angler hits the same wall. You know fish stack on temperature breaks and chlorophyll edges. You know satellites show them. But there are dozens of tools that all show slightly different layers at wildly different prices — and no clear map of which one you actually need.
This guide sorts the offshore-data market into plain categories and reviews the real players honestly. No tool here is bad; they just answer different questions. The trick is knowing which question is yours.
The Market Splits Into Two Categories — and a Third Is Emerging
1. Raw satellite imagery. Terrafin, FishTrack, RipCharts, SatFish, Hilton’s, and OceanTemp render SST, chlorophyll, and altimetry, and you interpret it. These are genuinely good tools if you already read water well — sharp imagery, cloud-free composites, altimetry and current overlays. The catch is right there in the name: they hand you the chart, not the conclusion.
2. Expert human analysis. ROFFS has oceanographers write you a plain-language forecast, and has done it for decades. It’s the gold standard for interpretation — a real scientist reading the same satellite data and telling you where and why — but it’s premium and human-paced.
3. AI interpretation — the emerging third category. Between “here’s the raw chart, good luck” and “pay a premium for a human,” there’s a wide-open middle, and SeaLegs AI’s DeepCast reports fill it. AI reads the same SST, chlorophyll, and altimetry data and names the likely fish-holding zones along the breaks — in plain language, at app-subscription price. Today it’s effectively the only tool doing this.
The Tools at a Glance
| Tool | Data layers | Delivery | Platform | Price |
|---|---|---|---|---|
| Terrafin | SST, chlorophyll, altimetry, cloud-free SST | Raw data | Web + app | $119/yr new, $109/yr renewal (all regions) |
| FishTrack | SST, chlorophyll, altimetry, currents, bathymetry | Raw data | Web + iOS/Android | $14.99/mo or $95.99/yr |
| RipCharts | SST, chlorophyll, altimetry, currents, bathymetry, true-color | Raw data | Web + app | $99/yr Standard, $169/yr Premium (no monthly) |
| SatFish | SST, chlorophyll, altimetry, currents | Raw data | Web + app | $129/yr (30-day trial) |
| Hilton’s Realtime-Navigator | SST, chlorophyll, altimetry, currents, bathymetry | Raw data (+ guidance) | Web + app | $200/yr first region, +$30 each add’l |
| OceanTemp | SST, chlorophyll | Raw data | Web | $99/yr (Florida/Mid-Atlantic) or $159/yr (Northeast) |
| ROFFS | Analyst-synthesized SST, chlorophyll, altimetry, currents | Human analysis | Emailed written analysis | Premium, quoted per analysis |
| SeaLegs AI (DeepCast) | SST, chlorophyll, altimetry, AI-synthesized into named fish-holding zones | AI analysis | App-based | $4.99/report or $39.99 for 10 ($3.99 each) — pay-per-report, no annual subscription |
Prices verified August 2026 against each vendor’s public order page. Subscription pricing changes without notice — check the vendor before you buy.
The Tools, Reviewed Honestly
Terrafin
One subscription covers every region, with SST, chlorophyll, altimetry, and clean cloud-free SST composites that fill the gaps clouds leave behind. Every other tool here charges you per region or per tier; Terrafin doesn’t — so if you fish more than one coast, it’s still the simplest bill on this page. Renewals drop to $109/yr.
Trade-off: it’s raw data — you do the interpreting.
FishTrack
A clean, well-built app across web and mobile, and the only major player with a real monthly option — handy if your offshore season is short and you don’t want to pay year-round. The layer set is deep: SST, chlorophyll, altimetry, currents, and bathymetry.
Trade-off: like the rest of this group, it shows you the water without reading it.
RipCharts
The widest layer set here — SST, chlorophyll, altimetry, currents, bathymetry, and true-color imagery all in one place. If you want every satellite layer on a single map, this is it. Note the two tiers: Premium ($169/yr) is the one that earns that description, with 8–20 SST updates a day, 2–3 chlorophyll passes, and salinity, sub-surface SST, and a 5-day SST forecast. Standard ($99/yr) drops those extras to 4–8 SST updates and a single chlorophyll pass — but it makes RipCharts the cheapest way onto this list.
Trade-off: Premium is the priciest tier here, and both tiers are annual-only — no monthly plan and no free trial before you commit.
SatFish
Clean, modern UX and a genuine 30-day trial — the easiest way to see whether a paid SST service earns its keep for how you fish before you spend a dollar. Solid coverage of SST, chlorophyll, altimetry, and currents.
Trade-off: it shows you the water; it doesn’t read it for you.
Hilton’s Realtime-Navigator
A tournament-grade favorite with a deep layer set and short-term day and week passes — useful when you’re prepping hard for a single event and want the best data for one stretch of coast. It layers light guidance on top of the raw charts.
Trade-off: the per-region pricing adds up fast if you fish more than one area.
OceanTemp
The no-app pick. Everything runs in a phone browser — nothing to install — and the real-time GPS tracking keeps working offshore once you’ve lost cell service, with LORAN grids on the Northeast and Mid-Atlantic charts. You buy one coast, not a catalog: Florida/Bahamas plus Mid-Atlantic is $99/yr for four zones, and the three-zone Northeast region is $159/yr.
Trade-off: leaner layers and a dated presentation next to the modern tools — and despite the regional scope, the Northeast plan costs more than Terrafin’s all-regions subscription.
ROFFS
The interpretation benchmark. A real oceanographer reads the SST, chlorophyll, altimetry, and currents for your area and writes you a plain-language analysis of where to fish and why. For decades this has been what “expert interpretation” means offshore.
Trade-off: premium priced and human-paced — you wait for a person to write it.
SeaLegs AI (DeepCast) — the AI read at software price
SeaLegs AI takes the same satellite inputs — SST, chlorophyll, altimetry — and has AI name the fish-holding zones along the breaks, in plain language, for a few dollars a report. And unlike a traditional fishing report, it folds the marine weather forecast — wind, waves, and the go/caution/avoid conditions for your window — into the same report, so you get where the fish should be and whether it’s a day worth running, in one place. It’s the only tool in the emerging third category: expert-level interpretation without the premium price or the homework — pay per report, no annual subscription.
See how SeaLegs AI reads offshore satellite data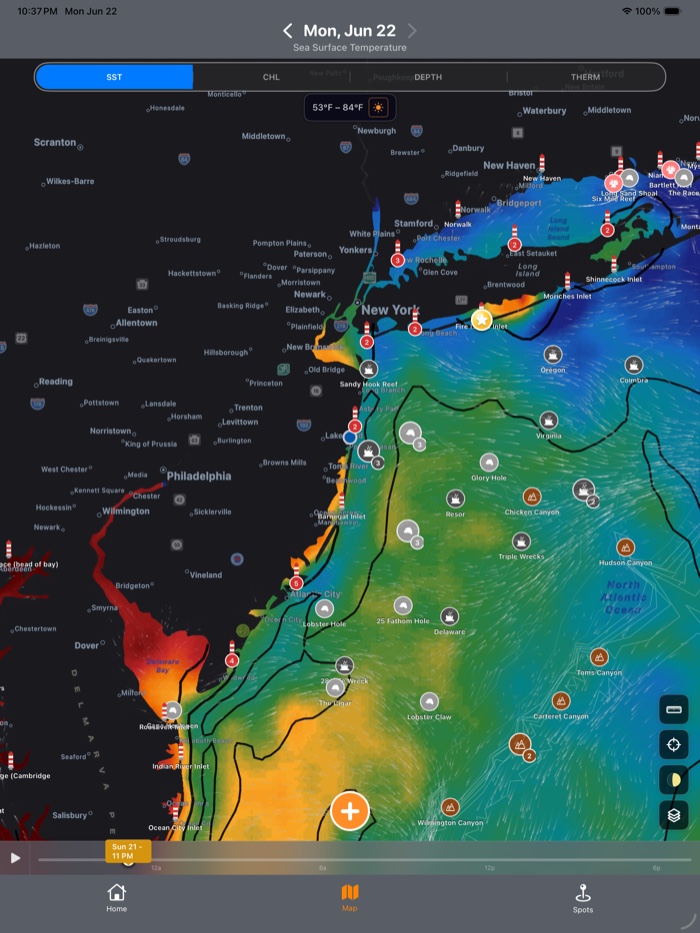
Why Interpretation Is the Part That Actually Matters
Seeing the break is the easy part. Every tool on this list shows the edges — the warm-to-cool boundary, the color line where clean water meets green. (If those terms are new, our guide to sea-surface temperature explains why fish stack on them.)
The hard part is the read. Which of six breaks on your screen is worth 40 miles of fuel? Is it tightening or falling apart? How does today’s chlorophyll line up with the SST — and with the altimetry showing an eddy spinning off the edge? (Eddies are their own high-percentage target; we cover them in the ocean eddy fishing guide.) Correlating four satellite layers in your head, in real time, is a genuine skill — the skill ROFFS charged a premium for.
That’s the gap the AI category closes. Instead of correlating four layers yourself, an AI report tells you which zones are staging fish and why. Raw tools show the break; an AI report tells you what to do with it.
How to Choose
- You already read water well and want the best raw imagery for the money → Terrafin or FishTrack (add SatFish to trial it first).
- You want the widest set of layers on one map → RipCharts, or Hilton’s if you fish one region hard.
- You want a human expert and cost is no object → ROFFS.
- You want the expert-style “where are the fish” read without the premium price or the homework → the AI category, i.e. SeaLegs AI.
If you’ve bought charts for years and still stare at the screen wondering which break to run, that’s exactly what AI interpretation solves. SeaLegs AI reads the SST, chlorophyll, and altimetry for your region and hands you a report that names the zones worth fishing — the read, not just the data.